
INTRODUCTION
Quantification of a trace amount of polymorphic impurity is critical in a number of industries but is especially so for the quality control of Active Pharmaceutical Ingredients (APIs) and drug products. Conventional quantitative by X-ray diffraction will usually require either establishing a calibration curve or making use of known information like reference intensity ratio (RIR) or crystal structure (Crystal Information File CIF). However, novel materials like APIs will likely not have the required prior knowledge and may not be available in the required pure forms for the development of a calibration curve. This can present a barrier to quantitation using traditional approaches. To address this challenge, Rigaku has developed a novel quantitative analysis method “Direct Derivation” (DD) that requires only measured XRD data along with the corresponding molecular/chemical formula (1)..(3). In this application note, the DD method is used to perform quantitative analysis of trace amounts of the hydrated API phase within an anhydrate matrix. The method LOQ is estimated visually from a single peak as well as the standard deviation of the analysis results over 10 measurements.
Measurements and Results
Figure 1 shows the method LOQ was estimated from the ten repeat measurements and taken to be 10 times the standard deviation in the quantitative result. Table 1 shows the results of the quantitative analysis and the estimated LOQ. From the magnified peak image in Figure 2, it is possible to visually estimate the LOD and hence LOQ for a single strong peak. The observed background noise has a 1 sigma level of about 15 to 20 counts. In principle, the visual LOD corresponds to peaks with an intensity of about 3.3 times the background noise and visual LOQ to peaks with intensity 10 times the background noise. So, the single peak visual LOQ level corresponds to peaks with intensity between 150 and 200 counts which is essentially the peak intensity observed for the 0.1 mass% hydrated API phase. The DD method will typically return lower LOQ levels than estimated visually from single peaks as it is a total pattern multipeak method.
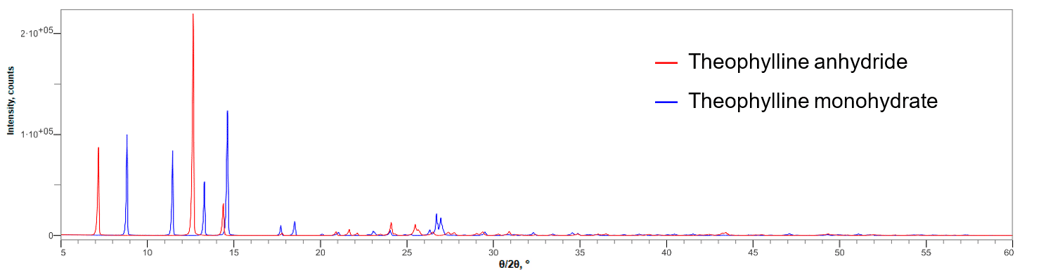
Fig.1: Multiple X-ray diffraction profiles of the anhydride and monohydrate of theophylline (Excerpts of 2θ = 5 to 60°)
Table 1: Quantitative value average
and quantitative lower limit
of theophylline monohydrate
(mass%)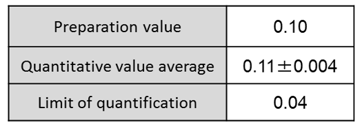
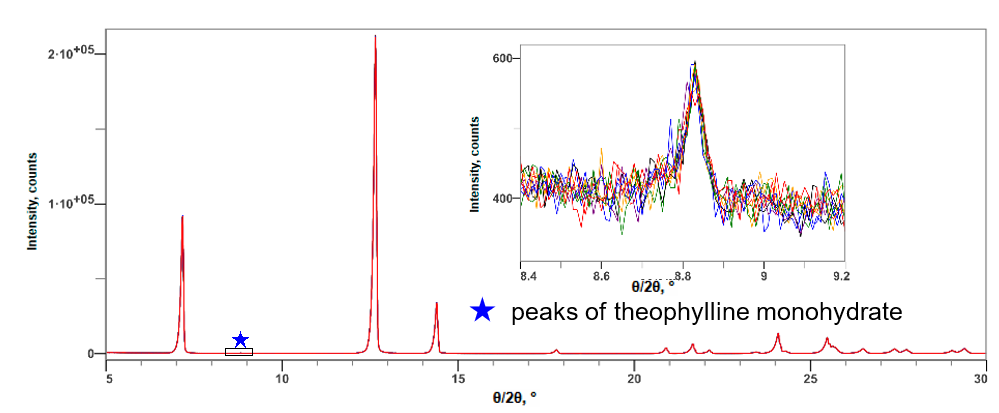
Fig.2: Multiple X-ray diffraction profiles of the anhydride and 0.10 mass% monohydrate mixture of theophylline (10 simple repeat measurement results)
References: (1) H. Toraya: J. Appl. Cryst., 49 (2016) 1508-1516.
(2) H. Toraya: Rigaku Journal (English version), 34 (1) (2018) 3-8.
(3) H. Toraya: J. Appl. Cryst., 50 (2017) 820–829.
Recommended equipment and software
► Automated multipurpose X-ray diffractometer SmartLab + ASC-10 (auto sample changer)
+ High-speed and high- resolution 1D detector D/teX Ultra250
► Integrated X-ray analysis software SmartLab Studio II (Powder XRD plugin)
RIGAKU RECOMMENDS
AUTOMATED MULTIPURPOSE X-RAY DIFFRACTOMETER SMARTLAB