
Abstract
There is no question that atomic pair distribution function analysis has had a profound impact on the analysis of crystalline and amorphous materials [1]. As a complement to the use of synchrotron sources for collecting PDF data, we have explored the use of home laboratory-based single crystal and powder diffractometers to analyze amorphous organic materials. In this document we will explore the collection and analysis of total scattering data collected on glassy molecular materials with wavelengths readily available to home laboratory systems. The difference between inter- and intra- molecular order and their respective impact on total diffraction data will be investigated.
Introduction
Total Diffraction and Pair Distribution Function (PDF) Analysis can be versatile tools for understanding the structure, and ultimately properties, of complex materials that are not tractable using traditional single crystal or powder diffraction methodologies. Applications of interest include: structure solution for nano materials, elucidation of structure beyond unit cell dimensions and the understanding the structure of glassy and amorphous materials. In this presentation, we will explore some novel approaches to structural analysis of glassy materials.
The application of Total Diffraction analysis, and in particular, PDF approaches rest on the shoulders of the Debye Diffraction Theory [3]. As described by the Debye theory, the diffraction from any ensemble of atoms or molecules can be described by an incoherent sum over the coherent diffraction intensity of every atom-atom pair in the ensemble. This can be expressed as:
I_D (Q)= ∑ fi2 + 2∑∑〖fi fj sin(Q di,j)/(Q dii,j〗
Where the single sum runs over all atoms 'i' and the double sum over atoms 'i' and 'j', fi are the individual atomic X-ray form factors for atom 'i', and di,j is the distance between the coherently related atoms 'i' and 'j'. The Debye diffraction equation is radially symmetric, depending only the magnitude of the diffraction vector Q. As such, its application relies on spherical symmetry within the measured data. For materials with highly asymmetric local structure, this can be achieved by spinning and rotating the sample during analysis. Glassy materials, in principle, exhibit inherent long range spherical symmetry and are ideal materials for Total Diffraction analysis.
A common challenge when performing total diffraction analysis is the transformation of the measured data to a reduced form where the Q dependent intensity variations induced by the instrumentation, diffraction geometry and sample arrangement are removed. For glassy materials, aside from the usual Lorentz-Polarization and absorption corrections, perhaps the most critical correction is removal of the instrumental background response. The reduced measured data will be referred to as the instrument-free data. The first step in robust Total Diffraction analysis is a robust data reduction procedure towards instrument-free data. One approach to this has been discussed previously [4] with respect to Synergy single crystal diffractometers. As such, data collected on the Synergy and processed to the instrument-free reduced form was utilized as a standard data set to optimize the data reduction procedures for different diffraction geometries.
The data against which the molecular modelling will be performed is the reduced pair distribution function, G(r). This function is the Fourier transform of the S(Q) function and most closely connected to the instrument-free data. During the modelling process, the calculated reduced PDF, Gc(r), is derived from the current state of the molecular model and compared with the experimental G(r). The calculated reduced PDF is given by:
Gc(r) = 1/r ∑∑{[(fi fj)/⟨f⟩2]δ(r-rij)]} -4πrρ0
where ⟨f⟩ is the average scattering factor, rij is the distance between atoms 'i' and 'j', and ρ0 is the atomic number density. The double sum is over all atom pairs in the unit cell. Between r=0 and the first atom pair, the function will have a slope of -4πrρ0.
Analysis and Experimental
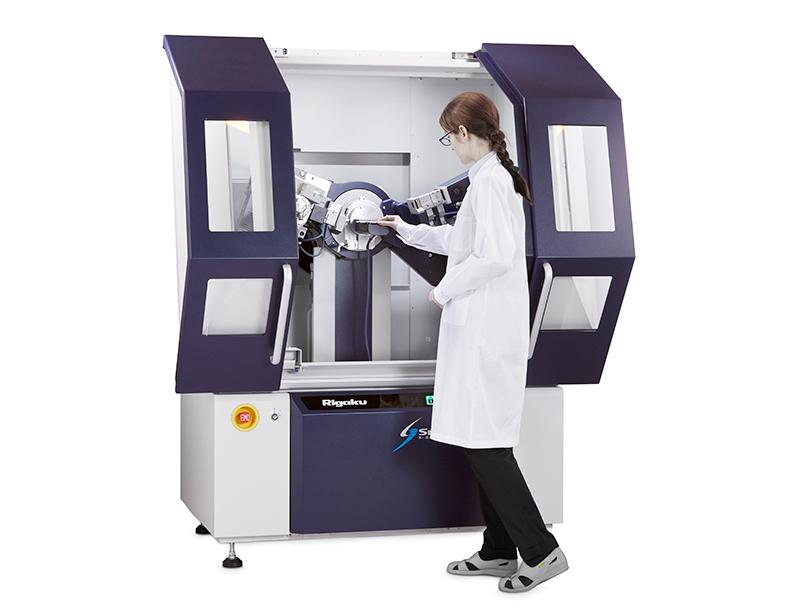
Although the final structural analysis will be performed against the reduced PDF, the appearance of Q(S(Q)-1) prior to Fourier transformation to the PDF can provide insight and guidance towards appropriate data collection and analysis methods. Figure 1 displays the reduced Q(S(Q)-1) response for an indomethacin (CSD refcode INDMET) glass sample measured on a Rigaku SmartLab SE system configured with Mo radiation and transmission capillary geometry.
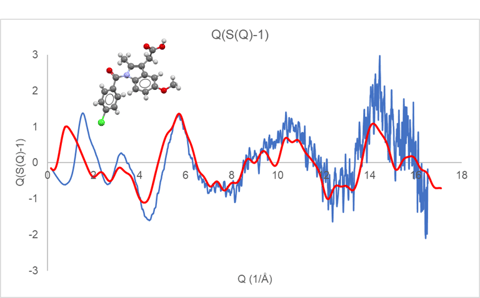
Figure 1. Q(S(Q)-1) derived from a measured indomethacin glass (blue) compared with the Debye response for a single rigid indomethacin molecule
A similar plot of Q(S(Q)-1) is displayed in Figure 2 for glassy nifedipine (CSD refcode BICCIZ) measured using a Synergy-R microdiffraction system using Mo radiation.
Displayed along with the experimental curves in Figures 1 and 2 are the calculated Debye response for a single molecule of indomethacin and nifedipine, respectively. At higher Q values, above a value of about 6, the observed diffraction response closely follows the single molecule response. While at lower Q values, below a value of about 5, there is a large discrepancy between the observed and simulated Q(S(Q)-1) response.
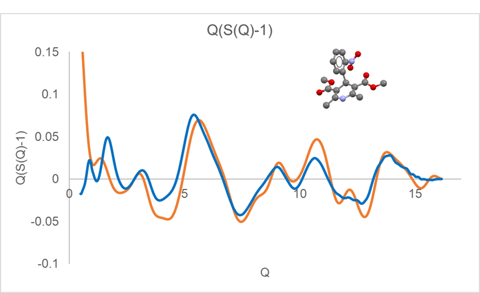
Figure 2. Q(S(Q)-1) derived from measured nifedipine (blue) compared with the Debye response for a single rigid nifedipine molecule (orange).
These comparisons illustrate that for amorphous and glassy materials, the higher Q diffraction response essentially arises from the inherent intramolecular structure. Furthermore, if refinement of molecular structure is the goal of the analysis, then the high Q component is important. However, if the rigid molecular structure is essentially known, then collecting data to high Q becomes less critical. Furthermore, the calculated Debye response for a rigid molecule can be used as a more appropriate normalization asymptote than the traditional atomic response. For organic molecular glassy materials, the use of a molecular Debye normalization allows the required Q range to be sufficiently reduced to allow useful measurements to be performed using Cu radiation.
The discrepancy between the measured and simulated Q(S(Q)-1) at lower Q is a result of the inter-molecular packing in the glassy state, which is often the critical structural feature most predictive of materials properties. Elucidation of this glassy intermolecular packing relationship is the focus of the work presented here.
Traditionally, packing within the glassy state has been modeled utilizing two very different approaches. One approach is to use large scale molecular dynamics and reverse Monte Carlo methods on models containing many thousands of molecules and then compare PDFs derived from the emerging structure with measured PDF data. An alternate approach, that will be used here, makes use of assumed model packing functions that describe the thermodynamically averaged intermolecular relationships within the glass sample. For this short communication, two model functions will be considered, the exclusion-zone and paracrystal as shown in Figure 3.
Figure 3. Traditional glassy packing functions for exclusion zone and paracrystal models.
During the automated structural analysis, the reduced PDF derived from the current state of the molecular model (single rigid molecule) is combined with current state of the exclusion-zone and paracrystal packing functions to give a model PDF that is compared with the reduced PDF derived from the measured data. Apart from scale factors, the primary refinement parameters defining the packing functions are related to a fundamental distance and effective length scale.
X-ray Total Diffraction data were collected on glassy nifedipine using two different instrument configurations. In one configuration, Mo X-rays were used and the sample measured in transmission using a microdiffraction geometry on a Rigaku Synergy-R system running at 1.2 kW. The nifedipine was melted and cast on a Mylar® sheet before being broken into small fragments (<1 mm) for analysis. The second measurement made use of Cu X-rays in a Bragg-Brentano reflection geometry on a SmartLab SE. The nifedipine was melted and quenched directly into a silicon low background holder, again forming a solid glass sample. The reduced data from these two measurements are displayed in Figure 4.
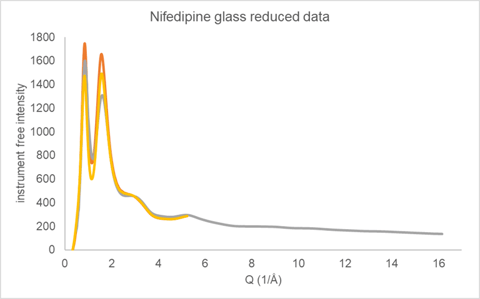
Figure 4. Reduced Total Diffraction data collected on glassy nifedipine using Cu reflection (yellow and orange) and Mo microdiffraction transmission (gray) geometries
The reflection geometry has additional intensity corrections factors to be applied during data reduction that relate to the illuminated sample surface area and absorption. Two different correction procedures were employed during data reduction giving the two Cu total diffraction responses presented in Figure 4. The Cu data was measured out to only 80 2θ (Q ~ 5.2 (1/Å)) as a stress test of the data reduction procedure. Both reduced total diffraction response for Cu were taken through the automated analysis procedure as a measure of robustness.
The reduced G(r) was generated from the measured data after removal of a scaled instrumental background and normalizing the residual to a calculated Debye response for a single rigid molecule of nifedipine. The reduced PDF for each measurement was modelled as a combination of rigid nifedipine molecular structure, exclusion zone and short-range intermolecular packing.
The reduced G(r) derived for the three total diffraction responses (Figure 4) are displayed in Figure 5. The data collected using Mo radiation out to higher Q clearly shows increased peak resolution when compared to the data collected using Cu radiation. The two G(r) functions derived using different data normalization procedures for the Cu data are very similar with some minor intensity differences.
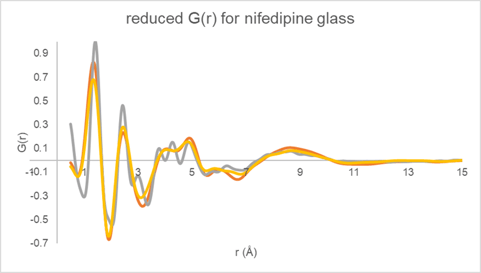
Figure 5. Reduced DF G(r) determined for glassy nifedipine using the two Cu total diffraction data sets (yellow and orange) and the Mo transmission data (gray).
The best fit to the reduced G(r) derived from the Cu data is shown in Figure 6. The overall Rw factor of about 0.105 is rather high for a relatively simple X-ray amorphous data set, but reasonable for Cu X-rays where the reduced measurement range forces the use of a rigid molecular model. The intermolecular packing functions were the primary modelling variable along with overall scale factors.
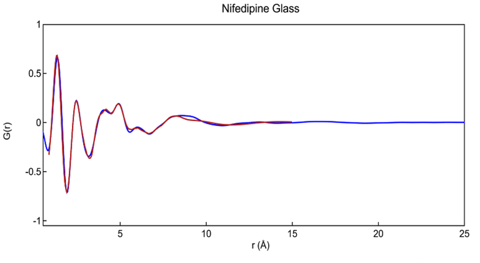
Figure 6. Reduced PDF G(r) measured for glassy nifedipine as modeled using single rigid molecule and variable packing functions. Final Rw = 0.105.
The inter-molecular packing functions derived for glassy nifedipine using the Cu reflection data passed through two different data reduction procedures and utilizing three different equilibrium molecular structure models (CSD refcodes: BICCIZ, ASATOD and BICCIZ04) are shown in Figure 7. Overall, the packing functions appear very similar in form, indicating the robustness of the automated analysis procedure.
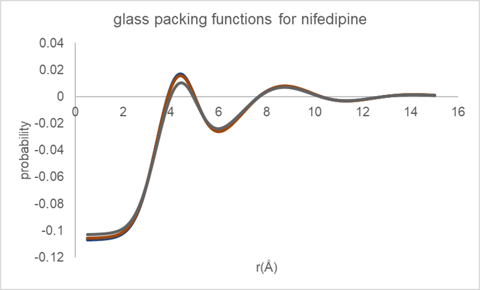
Figure 7. Molecular packing function derived for glassy nifedipine from Cu data.
The equivalent inter-molecular packing functions as derived using the Mo data along with the same three equilibrium molecular structures are shown in Figure 8. The packing functions as derived for glassy nifedipine are essentially the same independent of the data processing procedure or initial equilibrium molecular structure.
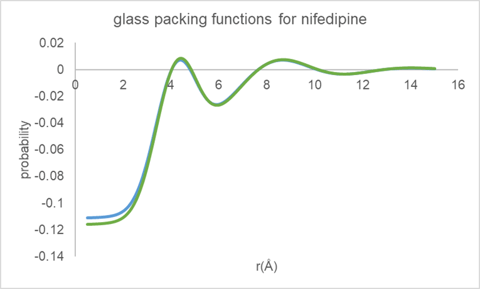
Figure 8. Molecular packing functions derived for glassy nifedipine using Mo data.
Results
Given a rigid molecular structure for nifedipine (taken from CSD refcodes BICCIZ, BICCIZ04 and ASATOD), the extracted glassy intermolecular packing function exhibits a weak nearest neighbor and next nearest neighbor intermolecular correlation. The fundamental paracrystalline packing distances as derived from the Cu and Mo data are displayed in Table 1.
|
Data |
Mean distance (Å) |
Standard deviation |
|
Cu reflection |
4.127 |
0.0071 |
|
Mo transmission |
4.096 |
0.0071 |
Table 1. Paracrystalline packing distances for glassy nifedipine.
Conclusion
An automated procedure has been developed that involves robust data processing and modeling to directly extract intermolecular packing functions from Total Diffraction data collected on organic glassy / amorphous materials. The amorphous intermolecular packing function can be regarded as a material finger-print for the specific amorphous / glassy material being studied. Due to the metastable nature of amorphous and glassy materials, this fingerprint is likely to be sensitive to the thermal history of the sample (manufacturing and storage) and could potentially be indicative of physical properties such as stability. With suitable and robust data reduction procedures, glassy / amorphous packing function analysis can be performed for organic systems using either Mo or Cu X-rays on either a general-purpose powder diffractometer or a single crystal diffractometer.
An earlier video presentation of the this work is available here.
References
[1] Underneath the Bragg Peaks: Structural Analysis of Complex Materials, T. Egami and S. J. L. Billinge, Elsevier, Amsterdam, 2012, ISBN: 978-0-08-097133-9.
[2] S. Bates 2019 International Tables for Crystallography. Vol. H. Ch. 5.6, pp. 617-648.
[2] Rigaku Oxford Diffraction, (2021), CrysAlisPro Software system, version 1.171.41.64, Rigaku Corporation, Wrocław, Poland.
[4] https://www.rigaku.com/applications/smx028
RIGAKU RECOMMENDS
AUTOMATED MULTIPURPOSE X-RAY DIFFRACTOMETER SMARTLAB